 FIGURE 33- 2
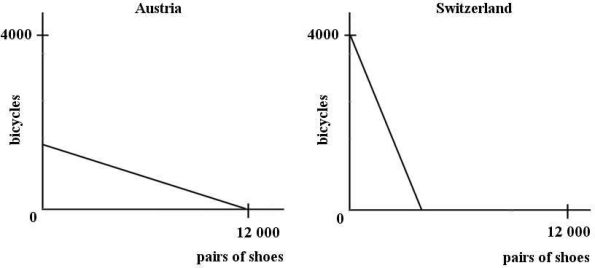
-Refer to Figure 33- 2. Each of the two diagrams is illustrating .
A) a budget line
B) a downward sloping demand curve
C) a production possibilities boundary
D) absolute advantage
E) a terms of trade index
Correct Answer:
Verified
Q26: The diagram below shows the domestic demand
Q42: Australia exports wine to Canada, and Canada
Q61: The diagram below shows Robinson Crusoe's annual
Q64: If two nations want to trade with
Q65: The diagram below shows Robinson Crusoe's annual
Q70: If two countries each produce wool and
Q77: The increases in a nation's output and
Q81: The following production possibilities schedule shows
Q83: This table shows how much cotton
Q86: This table shows how much wine
Unlock this Answer For Free Now!
View this answer and more for free by performing one of the following actions

Scan the QR code to install the App and get 2 free unlocks

Unlock quizzes for free by uploading documents