 FIGURE 3- 2
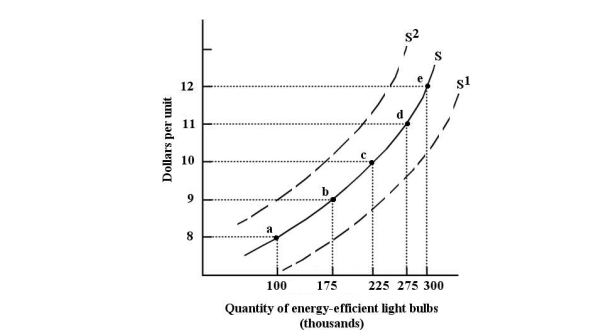
-Refer to Figure 3- 2. The movement along the supply curve, S, from point a to point c, could be caused by
A) an increase in the number of suppliers of energy- efficient light bulbs.
B) a decrease in the price of glass, a major input in the production of energy- efficient light bulbs.
C) a decrease in the price of ordinary light bulbs.
D) a decrease in the price of energy- efficient light bulbs.
E) an increase in the price of energy- efficient light bulbs.
Correct Answer:
Verified
Q64: If tastes change so that a particular
Q65: Quantity demanded is a flow variable, which
Q69: If there is no change in the
Q80: A rightward shift in the supply curve
Q82: A demand curve represents graphically
A)the timeless relationship
Q83: Good X has a substitute if there
Q84: If a change in tastes has raised
Q88: A variable that is a "stock"
A)has meaning
Q96: An improvement in the technology used to
Q97: The time period to which quantity demanded
Unlock this Answer For Free Now!
View this answer and more for free by performing one of the following actions

Scan the QR code to install the App and get 2 free unlocks

Unlock quizzes for free by uploading documents