FIGURE 2- 4 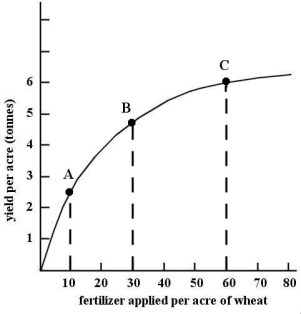
-Refer to Figure 2- 4.The slope of the non- linear function changes as we move along the curve.The slope is
A) negative and decreasing,indicating a diminishing marginal response.
B) constant at all points,indicating a constant marginal response.
C) negative and increasing,indicating an increasing marginal response.
D) positive and increasing,indicating an increasing marginal response.
E) positive and decreasing,indicating a diminishing marginal response.
Correct Answer:
Verified
Q75: Suppose economists at the Department of Finance
Q76: A scatter diagram
A)is a graph of a
Q77: Suppose that a particular theory predicts that
Q78: If we seek to explain the number
Q79: When it is said that variable A
Q80: Negatively related variables change such that as
Q82: The table below shows hypothetical tuition
Q83: A hypothesis (or a prediction)is a statement
Q84: Positively related variables change such that as
Q85: The table below shows hypothetical tuition
Unlock this Answer For Free Now!
View this answer and more for free by performing one of the following actions

Scan the QR code to install the App and get 2 free unlocks

Unlock quizzes for free by uploading documents