The diagram below shows supply and demand diagrams (S and D) for some product. The government then imposes an excise tax. The new supply curve is ST. 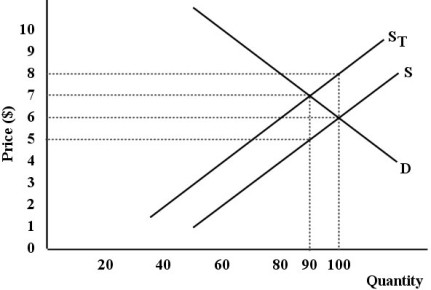 FIGURE 18- 4
-Refer to Figure 18- 4. What is the producers' revenue before the imposition of the tax?
A) $540
B) $600
C) $500
D) $630
E) $450
Correct Answer:
Verified
Q3: From the perspective of individuals, the goods
Q4: If a tax system contains some important
Q5: The figure below shows a simplified version
Q6: The diagram below shows supply and demand
Q7: The table below shows 2009 federal
Q9: Suppose a Canadian Member of Parliament suggests
Q10: Consider an income- tax system that requires
Q11: Consider a 10- percent excise tax that
Q12: The goods and services tax (GST) in
Q13: In 2009, the federal income- tax rate
Unlock this Answer For Free Now!
View this answer and more for free by performing one of the following actions

Scan the QR code to install the App and get 2 free unlocks

Unlock quizzes for free by uploading documents