The diagram below shows supply and demand diagrams (S and D) for some product. The government then imposes an excise tax. The new supply curve is ST. 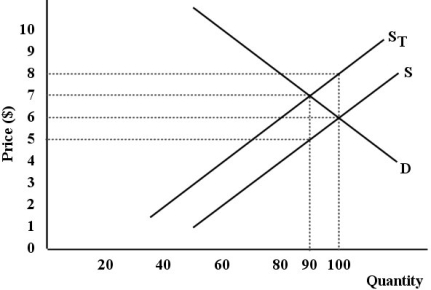 FIGURE 18- 4
-Refer to Figure 18- 4. What is the dollar value of the direct burden of this tax?
A) $450
B) $90
C) - $30
D) $180
E) $30
Correct Answer:
Verified
Q5: Q64: The figure below shows a simplified version Q65: Q66: The excess burden of an excise tax Q67: The various provincial sales taxes are mildly Q70: In 2008, tax revenues collected by all Q71: Some important taxes are regressive, such as Q72: Which of the following best describes the Q73: The Goods and Service Tax (GST) taxes Q74: The Canadian federal government's system of "equalization![]()
![]()
A)
A)
Unlock this Answer For Free Now!
View this answer and more for free by performing one of the following actions

Scan the QR code to install the App and get 2 free unlocks

Unlock quizzes for free by uploading documents