The diagram below shows the market for tradable pollution permits. 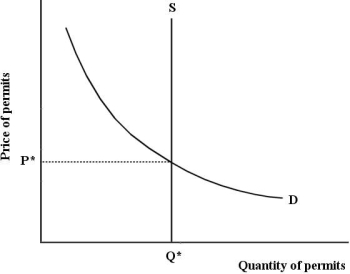 Figure 17- 7
-Refer to Figure 17- 7, which depicts the market for tradable pollution permits. If there is an increase in firms' marginal cost of pollution abatement,
A) the price of pollution permits will fall.
B) firms decide to abate more pollution.
C) firms will demand fewer pollution permits.
D) firms will demand more pollution permits.
E) firms require exactly Q* permits.
Correct Answer:
Verified
Q2: The marginal benefit of reducing pollution in
Q3: The major elements of the Kyoto Protocol
Q4: The table below shows the marginal
Q5: The optimal amount of pollution abatement is
Q6: Economists generally view pollution as
A) a positive
Q8: The diagram below shows the marginal cost
Q9: In a competitive market for tradable pollution
Q10: A pollution- control policy that, in principle,
Q11: If a per- unit tax on a
Q12: Consider a coal- fired electric- power plant
Unlock this Answer For Free Now!
View this answer and more for free by performing one of the following actions

Scan the QR code to install the App and get 2 free unlocks

Unlock quizzes for free by uploading documents