The diagram below shows the marginal cost of pollution abatement for two firms, Firm X and Firm Y. 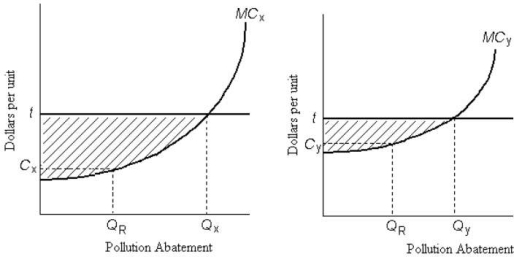 FIGURE 17- 4
-Refer to Figure 17- 4. Firms X and Y have an emissions tax of $t imposed on each unit of pollution they produce. If Firm X chooses to abate QX units of pollution, the total cost of its abatement is
A) tax amount t multiplied by the level of pollution abatement, QX.
B) area beneath the marginal cost of pollution abatement curve.
C) area below the horizontal line at t and above the MC of pollution abatement curve.
D) area beneath the marginal cost of pollution abatement curve up to QX.
E) tax amount t multiplied by the maximum possible level of pollution abatement.
Correct Answer:
Verified
Q22: Federal regulation aimed at reducing greenhouse- gas
Q23: The diagram below show the private and
Q24: The socially optimal level of output is
Q25: Consider the following equation:
Q26: When an external cost associated with the
Q28: When designing a policy to reduce polluting
Q29: The diagram below show the private and
Q30: The figure below shows the demand and
Q31: The main advantage of using market- based
Q32: The diagram below shows the marginal cost
Unlock this Answer For Free Now!
View this answer and more for free by performing one of the following actions

Scan the QR code to install the App and get 2 free unlocks

Unlock quizzes for free by uploading documents