The diagram below shows the marginal costs of pollution abatement for two firms, Firm 1 and Firm 2. 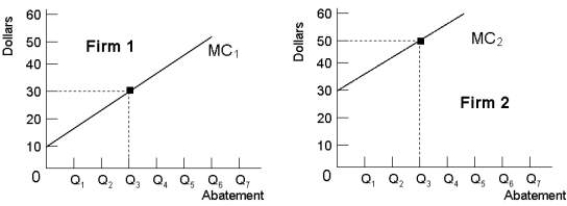 FIGURE 17- 5
-Refer to Figure 17- 5. Suppose Firm 1 and Firm 2 are each abating Q3 units of pollution. If the government imposes an emissions tax of $20 per unit of emissions,
A) Firm 1 will increase abatement beyond Q3 and Firm 2 will abate less than Q3.
B) Firm 1 and Firm 2 will each increase abatement beyond Q3.
C) the level of pollution abatement will be optimal.
D) Firm 1 will abate less than Q3, and Firm 2 will not abate any pollution at all.
E) neither firm will abate any pollution.
Correct Answer:
Verified
Q49: Automobile emissions standards are an example of
A)
Q50: Consider a coal- fired electric- power plant
Q51: A downward- sloping marginal benefit curve for
Q52: The figure below shows the marginal benefit
Q53: Consider two firms, A and B, that
Q55: All of the following are examples of
Q56: A paper mill discharges chemicals into a
Q57: In 2006, Professor Nicolas Stern of the
Q58: The diagram below shows the marginal cost
Q59: Suppose the government imposes an emissions tax
Unlock this Answer For Free Now!
View this answer and more for free by performing one of the following actions

Scan the QR code to install the App and get 2 free unlocks

Unlock quizzes for free by uploading documents