The figure below shows the marginal benefit to consumers, MB, the marginal cost to private firms, MCp, and the marginal cost to society, MCs, at each level of output of some good. 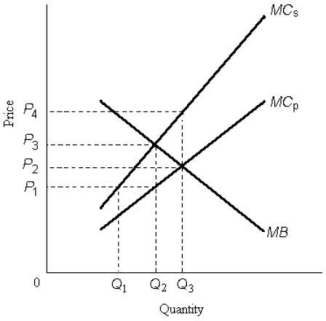 FIGURE 17- 1
-Refer to Figure 17- 1. The socially optimal level of output is
A) Q1.
B) Q3.
C) Q2.
D) zero.
E) none of the above; there is no optimal output level.
Correct Answer:
Verified
Q47: The social marginal cost of the production
Q48: Between 1990 and 2004, Canada's greenhouse gas
Q49: Automobile emissions standards are an example of
A)
Q50: Consider a coal- fired electric- power plant
Q51: A downward- sloping marginal benefit curve for
Q53: Consider two firms, A and B, that
Q54: The diagram below shows the marginal costs
Q55: All of the following are examples of
Q56: A paper mill discharges chemicals into a
Q57: In 2006, Professor Nicolas Stern of the
Unlock this Answer For Free Now!
View this answer and more for free by performing one of the following actions

Scan the QR code to install the App and get 2 free unlocks

Unlock quizzes for free by uploading documents