The diagram below shows the market for tradable pollution permits. 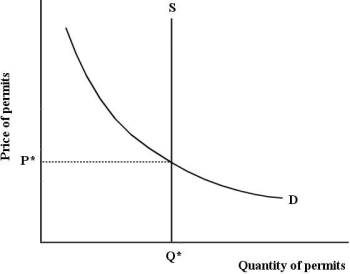 Figure 17- 7
-Refer to Figure 17- 7, which depicts the market for tradable pollution permits. The equilibrium price p*
A) is not a function of the abatement technology.
B) is always equal to the subsidy provided by the government.
C) equals the average abatement cost for firms.
D) is imposed by the government.
E) equals the marginal abatement cost for each profit- maximizing firm.
Correct Answer:
Verified
Q52: The marginal benefit of reducing pollution and
Q64: A potential disadvantage of emissions taxes versus
Q65: The figure below shows the marginal benefit
Q66: Consider the following equation:
Q67: In general, the economist's view on allocating
Q68: A paper mill discharges chemicals into a
Q70: Two firms, A and B, are legally
Q71: When comparing a system of emission taxes
Q73: Zero pollution is almost surely NOT a
Q74: Direct pollution controls are usually inefficient because,
Unlock this Answer For Free Now!
View this answer and more for free by performing one of the following actions

Scan the QR code to install the App and get 2 free unlocks

Unlock quizzes for free by uploading documents