The figure below shows the demand and supply curves for pollution abatement. 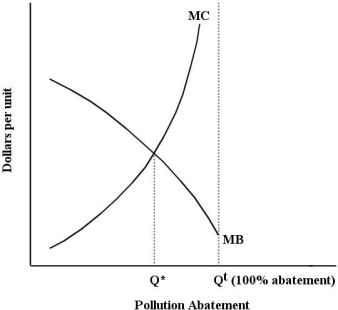 FIGURE 17- 3
-Refer to Figure 17- 3. The MB curve in this diagram is downward sloping because
A) the marginal cost of additional units of pollution abatement is decreasing.
B) the marginal cost of additional units of pollution abatement increases as pollution abatement increases.
C) the marginal benefit from a given amount of abatement will be higher, the higher the level of pollution abated.
D) the marginal benefit from a given amount of abatement will be lower, the lower the level of pollution.
E) the marginal damage generated by additional units of pollution is decreasing.
Correct Answer:
Verified
Q86: The figure below shows the demand and
Q87: An important reason that direct pollution controls
Q88: The table below shows the marginal
Q89: When firms in an industry have fully
Q90: Zero environmental damage is probably
A) neither technologically
Q92: The diagram below shows the market for
Q93: Direct pollution controls are likely to be
Q94: The diagram below shows the marginal costs
Q95: If residential garbage collection were financed by
Q96: The table below shows the marginal
Unlock this Answer For Free Now!
View this answer and more for free by performing one of the following actions

Scan the QR code to install the App and get 2 free unlocks

Unlock quizzes for free by uploading documents