The diagram below shows the marginal costs of pollution abatement for two firms, Firm 1 and Firm 2. 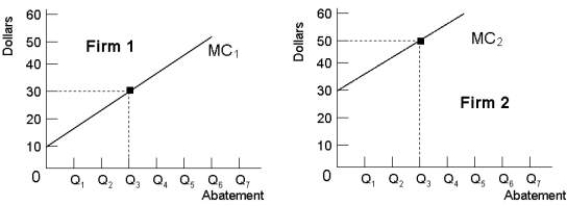 FIGURE 17- 5
-Refer to Figure 17- 5. Suppose Firm 1 and Firm 2 are each abating Q3 units of pollution. If the government imposed an emissions tax of $40 per unit of emissions, and this tax rate was known to equal the social marginal cost of pollution, then we can predict with confidence that
A) each firm would abate to the same level.
B) each firm would abate to Q3.
C) Firm 2 would increase abatement beyond Q3 and Firm 1 would abate less than Q3.
D) the resulting level of pollution would be optimal.
E) Firm 2 would increase its emissions and this would not be socially optimal.
Correct Answer:
Verified
Q89: When firms in an industry have fully
Q90: Zero environmental damage is probably
A) neither technologically
Q91: The figure below shows the demand and
Q92: The diagram below shows the market for
Q93: Direct pollution controls are likely to be
Q95: If residential garbage collection were financed by
Q96: The table below shows the marginal
Q97: The diagram below show the private and
Q98: The diagram below shows the marginal cost
Q99: The figure below shows the demand and
Unlock this Answer For Free Now!
View this answer and more for free by performing one of the following actions

Scan the QR code to install the App and get 2 free unlocks

Unlock quizzes for free by uploading documents