The figure below shows the marginal benefit to consumers, MB, the marginal cost to private firms, MCp, and the marginal cost to society, MCs, at each level of output of some good. 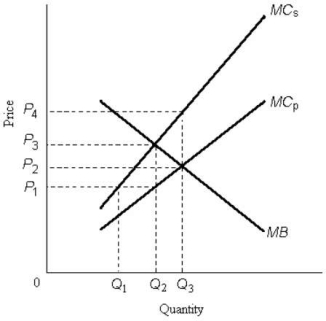 FIGURE 17- 1
-Refer to Figure 17- 1. A negative externality is depicted because the
A) marginal social cost is greater than the marginal private cost.
B) optimal level of output occurs where marginal private benefit is positive.
C) optimal level of output occurs where marginal private cost is positive.
D) marginal social benefit to consumers is diminishing with greater output.
E) marginal social cost is greater than the marginal social benefit.
Correct Answer:
Verified
Q77: When the marginal costs of pollution abatement
Q78: The diagram below shows the marginal costs
Q79: The banning of wood- burning stoves and
Q80: As a method of pollution control, tradable
Q81: The aggregate emission- reduction targets of the
Q83: The diagram below shows the marginal cost
Q84: When considering an entire industry, the marginal
Q85: The diagram below shows the market for
Q86: The figure below shows the demand and
Q87: An important reason that direct pollution controls
Unlock this Answer For Free Now!
View this answer and more for free by performing one of the following actions

Scan the QR code to install the App and get 2 free unlocks

Unlock quizzes for free by uploading documents