The diagram below shows the marginal cost of pollution abatement for two firms, Firm X and Firm Y. 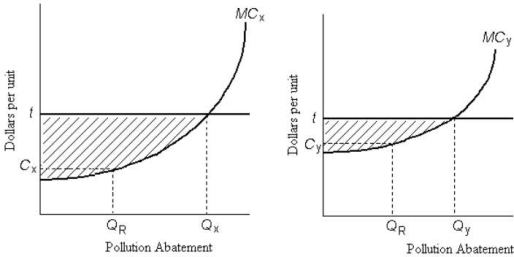 FIGURE 17- 4
-Refer to Figure 17- 4. There is an emissions tax of $t per unit of pollution. Which of the following statements regarding the pollution abatement activities by the two firms is correct?
A) It is not socially optimal to have Firm X doing pollution abatement of QX while Firm Y does the lesser amount, QY.
B) The emissions tax causes an optimal level of pollution.
C) It is efficient for Firm Y to do less pollution abatement than Firm X because Firm Y faces higher costs of abatement.
D) The emissions tax causes no change in the firms' polluting activity.
E) The shaded areas in the two graphs depict the social costs of pollution caused by Firms X and Y.
Correct Answer:
Verified
Q100: The marginal benefit of reducing pollution and
Q101: The diagram below shows the marginal cost
Q102: Suppose a competitive market for tradable pollution
Q103: An emissions tax (imposed on each unit
Q104: A paper mill discharges chemicals into a
Q105: The diagram below shows the marginal cost
Q107: The diagram below shows the marginal costs
Q108: Consider an oil company extracting oil from
Q109: A paper mill discharges chemicals into a
Q110: Two firms, A and B, are legally
Unlock this Answer For Free Now!
View this answer and more for free by performing one of the following actions

Scan the QR code to install the App and get 2 free unlocks

Unlock quizzes for free by uploading documents