The diagram below shows the marginal cost of pollution abatement for two firms, Firm X and Firm Y. 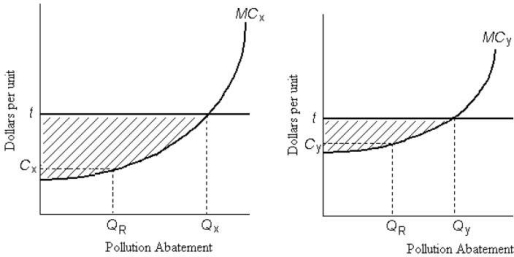 FIGURE 17- 4
-Refer to Figure 17- 4. Ignore the horizontal line at t. Suppose Firms X and Y are each abating QR units of pollution. If Firm X then reduces pollution by one unit and Firm Y increases pollution by one unit, then
A) the total cost of abatement remains the same but pollution increases.
B) the total costs of abatement and the amount of pollution do not change.
C) the total cost of abatement remains the same but pollution falls.
D) total pollution remains the same but the total cost of abatement increases.
E) total pollution remains the same but the total cost of abatement falls.
Correct Answer:
Verified
Q96: The table below shows the marginal
Q97: The diagram below show the private and
Q98: The diagram below shows the marginal cost
Q99: The figure below shows the demand and
Q100: The marginal benefit of reducing pollution and
Q102: Suppose a competitive market for tradable pollution
Q103: An emissions tax (imposed on each unit
Q104: A paper mill discharges chemicals into a
Q105: The diagram below shows the marginal cost
Q106: The diagram below shows the marginal cost
Unlock this Answer For Free Now!
View this answer and more for free by performing one of the following actions

Scan the QR code to install the App and get 2 free unlocks

Unlock quizzes for free by uploading documents