The diagram below shows the marginal benefit and marginal cost of a public good. This economy has 3 individuals, A, B and C. The diagram shows the MB for each individual and a summation of their marginal benefits. 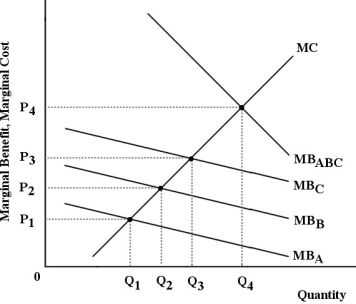 FIGURE 16- 4
-Refer to Figure 16- 4. Suppose the government provides Q4 units of the public good. If consumers were then required to pay a price of P4 ,
A) the appropriate price would be achieved, although not enough would be consumed.
B) the market would clear, although not enough would be produced.
C) consumers would not use the public good at all, and this would not be an efficient outcome for society.
D) the inefficient quantity would be being produced.
E) consumers would not use the public good at all, and this would be socially optimal.
Correct Answer:
Verified
Q65: In a free- market economy,
A) the existence
Q66: The "formal defence" of free markets includes
Q67: In a free- market system, a disequilibrium
Q68: The diagram below shows the supply and
Q69: Economists describe prices as "signals" in a
Q71: Economists consider a product such as a
Q72: The "informal defence" of free markets includes
Q73: Common- property fishing grounds are
A) often overexploited
Q74: One reason that national defence is a
Q75: Government intervention in a particular industry is
Unlock this Answer For Free Now!
View this answer and more for free by performing one of the following actions

Scan the QR code to install the App and get 2 free unlocks

Unlock quizzes for free by uploading documents