The diagram below shows the marginal benefit and marginal cost of a public good. This economy has 3 individuals, A, B and C. The diagram shows the MB for each individual and a summation of their marginal benefits. 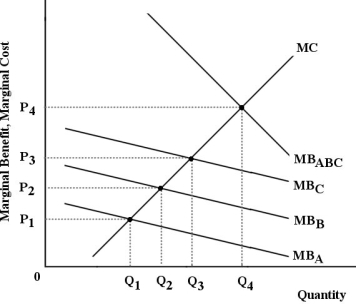 FIGURE 16- 4
-Refer to Figure 16- 4. The curve MBABC is derived by
A) observation of the consumption of public goods at a price of zero.
B) observation of the consumption of public goods at the optimal price.
C) a horizontal summation of the marginal benefits of all individuals at each given price level.
D) determining the private marginal cost of the public good.
E) a vertical summation of the marginal benefits of all individuals at each level of output.
Correct Answer:
Verified
Q90: Government intervention to correct market failures may
Q91: Which of the following roles of the
Q92: Refer to Figure 16- 1. Suppose that
Q93: One cause of allocative inefficiency is
A) perfect
Q94: The problem with externalities is essentially one
Q96: In a competitive market economy with no
Q97: A homeowner decides to buy three large
Q98: It is inefficient for the government to
Q99: The fact that it is difficult to
Q100: Economists generally agree that government intervention in
Unlock this Answer For Free Now!
View this answer and more for free by performing one of the following actions

Scan the QR code to install the App and get 2 free unlocks

Unlock quizzes for free by uploading documents