The diagram below shows the supply and demand for labour in a hypothetical town in northern British Columbia, with only one employer, a logging company. 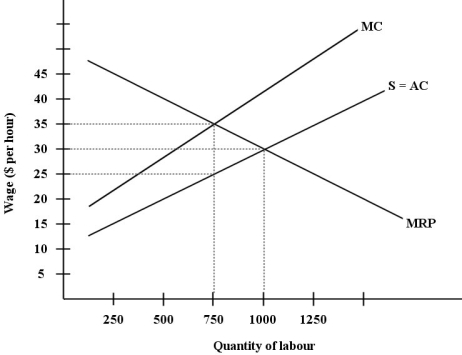 FIGURE 14- 4
-Refer to Figure 14- 4. Suppose this labour market is in a monopsonistic equilibrium. Then, suppose the workers form a union to negotiate the wage with the firm. In this case the wage will be
And the employment will be .
A) $30 per hour; 1000 units of labour
B) $35 per hour; 750 units of labour
C) above $35 per hour; less than 750 units of labour
D) above $25 per hour; above or below 750 units of labour, depending on the negotiated wage
E) between $25 and $35 per hour; between 750 and 1000 units of labour
Correct Answer:
Verified
Q1: If you choose to stay in school
Q4: In terms of human capital, which of
Q5: The following statements describe the adverse effects
Q6: Suppose there is a competitive market for
Q9: If a union succeeds in shifting the
Q10: A typical firm hiring in a perfectly
Unlock this Answer For Free Now!
View this answer and more for free by performing one of the following actions

Scan the QR code to install the App and get 2 free unlocks

Unlock quizzes for free by uploading documents