The diagram below shows the MRP curve for a firm producing high school math textbooks. The factor of production being considered here is hours of labour. 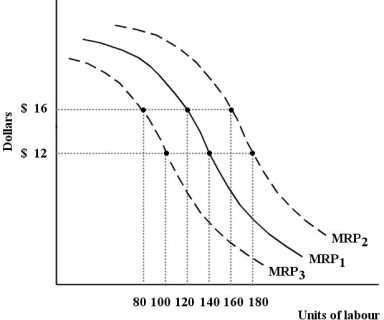 FIGURE 13- 2
-Refer to Figure 13- 2. Suppose this firm initially has the marginal revenue product curve MRP1. One reason that the curve could shift to MRP3 is
A) an increase in the wage rate.
B) an increase in the marginal product of labour.
C) an increase in demand for the firm's output, math textbooks.
D) a decrease in the market price of math textbooks.
E) a decrease in the supply of labour.
Correct Answer:
Verified
Q1: Consider the following production and cost
Q2: If at a particular wage rate in
Q4: Suppose that the last unit of a
Q5: The marginal revenue product curve for a
Q6: Consider the following production and cost
Q7: Median family income (pre- tax) in Canada
Q8: Suppose the government decides, in the interest
Q10: The demand and supply curves shown below
Q11: Suppose the following conditions existed in the
Q117: Consider the following production and cost
Unlock this Answer For Free Now!
View this answer and more for free by performing one of the following actions

Scan the QR code to install the App and get 2 free unlocks

Unlock quizzes for free by uploading documents