 FIGURE 13- 1
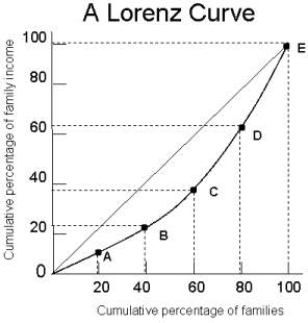
-Refer to Figure 13- 1. On the Lorenz curve shown in the diagram,
A) the richest 20 percent of families earn over 60 percent of total income.
B) the richest 20 percent of families earn almost 40 percent of total income.
C) the functional distribution of income is shown.
D) the poorest 20 percent of families earn almost 90 percent of total income.
E) perfect equality of income distribution occurs.
Correct Answer:
Verified
Q10: The demand and supply curves shown below
Q11: Suppose the following conditions existed in the
Q12: The table below shows the total
Q13: Steve Nash is a highly paid professional
Q15: The marginal revenue product of labour is
Q17: If the supply curve for a factor
Q18: A demand for a factor of production
Q19: Other things being equal, if it becomes
Q26: Consider the following table for a firm.The
Q117: Consider the following production and cost
Unlock this Answer For Free Now!
View this answer and more for free by performing one of the following actions

Scan the QR code to install the App and get 2 free unlocks

Unlock quizzes for free by uploading documents