The three diagrams below each show a supply curve for oil tankers over a relatively short period of time. 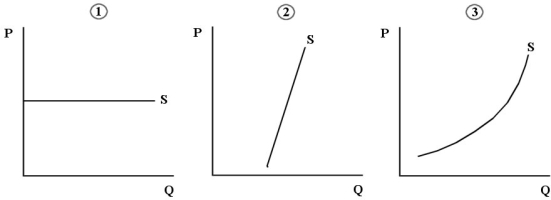 FIGURE 13- 3
-Refer to Figure 13- 3. Consider the supply of oil tankers to an individual Canadian firm, the North American shipping industry, and the world shipping industry. Which diagram best shows the supply of oil tankers that is relevant to an individual Canadian firm?
A) diagram 1
B) diagram 2
C) diagram 3
D) diagrams 2 or 3
E) diagrams 1 or 2
Correct Answer:
Verified
Q11: Consider the following production and cost schedule
Q17: Consider the following production and cost schedule
Q37: Suppose that experienced oil- field workers are
Q38: A Lorenz curve shows the
A) level of
Q39: The term "economic rent" refers to
A) economic
Q40: Suppose Harrison Ford makes 2 movies per
Q41: Consider the perfectly competitive labour market for
Q43: The aggregate quantity of labour supplied will
Q44: Consider the following production and cost
Q45: The demand for a factor will be
Unlock this Answer For Free Now!
View this answer and more for free by performing one of the following actions

Scan the QR code to install the App and get 2 free unlocks

Unlock quizzes for free by uploading documents