The three diagrams below each show a supply curve for oil tankers over a relatively short period of time. 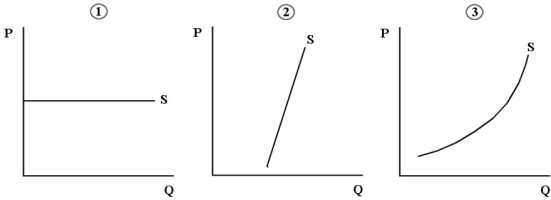 FIGURE 13- 3
-Refer to Figure 13- 3. Consider the supply of oil tankers to an individual Canadian firm, the North American shipping industry, and the world shipping industry. Which diagram best shows the supply of oil tankers that is relevant to the world shipping industry?
A) diagram 1
B) diagram 2
C) diagram 3
D) diagrams 2 or 3
E) diagrams 1 or 2
Correct Answer:
Verified
Q64: Q65: Consider the following production and cost Q66: Q67: Consider the following production and cost Q68: A temporary factor- price differential is one Q70: Consider the following table for a Q71: Which of the following is the best Q72: If a technological change makes it harder Q73: If small changes in incentives can induce Q74: The diagram below shows the MRP curve![]()
![]()
Unlock this Answer For Free Now!
View this answer and more for free by performing one of the following actions

Scan the QR code to install the App and get 2 free unlocks

Unlock quizzes for free by uploading documents