The demand and supply curves shown below apply to a competitive market for a factor in the production of widgets. 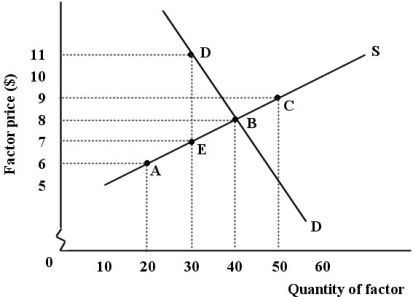 FIGURE 13- 5
-Refer to Figure 13- 5. This factor market is initially in equilibrium at point B, but changes occur that cause the equilibrium to shift to point D (S curve shifts left) . At the new equilibrium, total factor earnings compared to the initial equilibrium.
A) remained the same
B) decreased by $30
C) increased by $10
D) increased by $30
E) increased by $330
Correct Answer:
Verified
Q97: All profit- maximizing firms increase production up
Q98: For any firm in any market structure,
Q99: The hypothesis of equal net advantage explains
Q100: Consider the following production and cost
Q101: Consider the following production and cost
Q103: Factors of production (land, labour, and capital)
Q104: Consider the following table for a
Q105: The diagram below shows the MRP curve
Q106: Consider a small firm that is producing
Q107: Consider the following demand and supply curves
Unlock this Answer For Free Now!
View this answer and more for free by performing one of the following actions

Scan the QR code to install the App and get 2 free unlocks

Unlock quizzes for free by uploading documents