The diagram below shows the demand and supply curves in a perfectly competitive market. 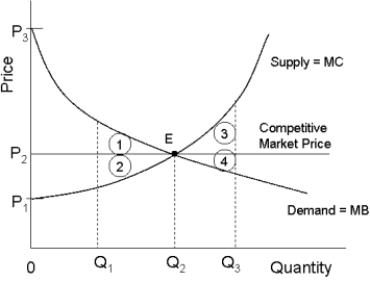 FIGURE 12- 5
-Refer to Figure 12- 5. At the free- market equilibrium, consumer surplus is represented by the area
A) P1P3E.
B) P1P2E.
C) 1 +2.
D) P2P3E.
E) 1 + 2 + 3 + 4.
Correct Answer:
Verified
Q10: Suppose we compare two monopolists with identical
Q11: In general, the sum of consumer and
Q12: Q13: For an entire economy, allocative efficiency requires Q14: Suppose your municipality charges your household a Q16: In the absence of market failures, allocative Q17: Consider a regulated natural monopoly, such as Q18: In the long run, the imposition of Q19: Consider three firms, A, B and C, Q20: When comparing a perfectly competitive firm and![]()
Unlock this Answer For Free Now!
View this answer and more for free by performing one of the following actions

Scan the QR code to install the App and get 2 free unlocks

Unlock quizzes for free by uploading documents