The diagram below shows the market demand curve and the cost curves for a single firm. 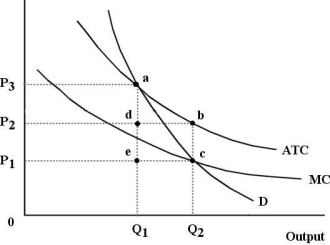 FIGURE 12- 6
-Refer to Figure 12- 6. Suppose this firm is being regulated using the policy of marginal- cost pricing. The resulting price and output would be
A) P1 and Q2.
B) P2 and Q2.
C) P1 and Q1.
D) P3 and Q2.
E) P3 and Q1.
Correct Answer:
Verified
Q35: Canadian governments (federal, provincial and municipal) employ
Q36: The diagram below shows supply, demand, and
Q37: The deadweight loss of monopoly is
A) the
Q38: Consumer surplus represents
A) the marginal value that
Q39: Which of the following is an example
Unlock this Answer For Free Now!
View this answer and more for free by performing one of the following actions

Scan the QR code to install the App and get 2 free unlocks

Unlock quizzes for free by uploading documents