The diagram below shows the market demand curve and the cost curves for a single firm. 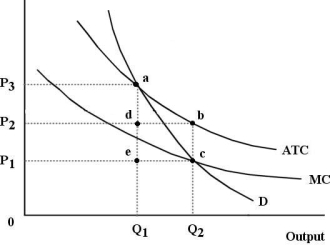 FIGURE 12- 6
-Refer to Figure 12- 6. Suppose this firm is being regulated using a policy of average- cost pricing. In this case, economic profits to the firm are represented by the area
A) P2P3ad
B) P1P2bc
C) 0P3aQ1
D) P2P3ab
E) there are no economic profits.
Correct Answer:
Verified
Q60: Q61: The diagram below shows the demand and Q62: The diagram below shows the market demand Q63: Consider the case of a natural monopoly Q64: The diagram below shows supply, demand, and Q66: The diagram below shows the demand and Q67: Allocative efficiency is a property of the Q68: The diagram below shows cost and revenue Q69: Allocative efficiency concerns Q70: Consider two firms, A and B, that![]()
A) the allocation of resources
Unlock this Answer For Free Now!
View this answer and more for free by performing one of the following actions

Scan the QR code to install the App and get 2 free unlocks

Unlock quizzes for free by uploading documents