The diagram below shows cost and revenue curves for a natural monopoly producing electricity. Price is dollars per kilowatt hour and quantity is kilowatt hours per day. 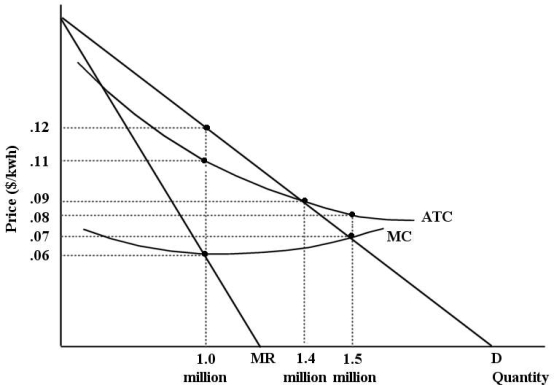 FIGURE 12- 7
-Refer to Figure 12- 7. If this firm were unregulated and profit maximizing, its profit would be
Per day.
A) $60 000
B) $120 000
C) $110 000
D) $0
E) $10 000
Correct Answer:
Verified
Q63: Consider the case of a natural monopoly
Q64: The diagram below shows supply, demand, and
Q65: The diagram below shows the market demand
Q66: The diagram below shows the demand and
Q67: Allocative efficiency is a property of the
Q69: Allocative efficiency concerns
A) the allocation of resources
Q70: Consider two firms, A and B, that
Q71: The production possibilities boundary shows possible combinations
Q72: The production possibilities boundary shows possible combinations
Q73: The diagram below shows cost and revenue
Unlock this Answer For Free Now!
View this answer and more for free by performing one of the following actions

Scan the QR code to install the App and get 2 free unlocks

Unlock quizzes for free by uploading documents