 FIGURE 12- 3
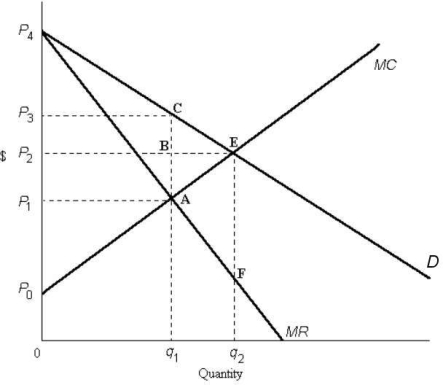
-Refer to Figure 12- 3. If the diagram depicts a perfectly competitive industry, the equilibrium price and quantity is
A) P3 and q1.
B) P1 and q1.
C) P1 and q2.
D) P2 and q1.
E) P2 and q2.
Correct Answer:
Verified
Q87: The diagram below shows the demand and
Q88: Allocative efficiency occurs when
A) the sum of
Q89: Consider a natural monopoly that has declining
Q90: Consider three firms, A, B and C,
Q91: If a regulatory agency imposes a lump-
Q93: Consider three firms, A, B and C,
Q94: At the level of the industry, the
Q95: The diagram below shows supply, demand, and
Q96: Allocative efficiency is actively sought
A) only by
Q97: Prior to the 1986 amendments to the
Unlock this Answer For Free Now!
View this answer and more for free by performing one of the following actions

Scan the QR code to install the App and get 2 free unlocks

Unlock quizzes for free by uploading documents