 FIGURE 11- 2
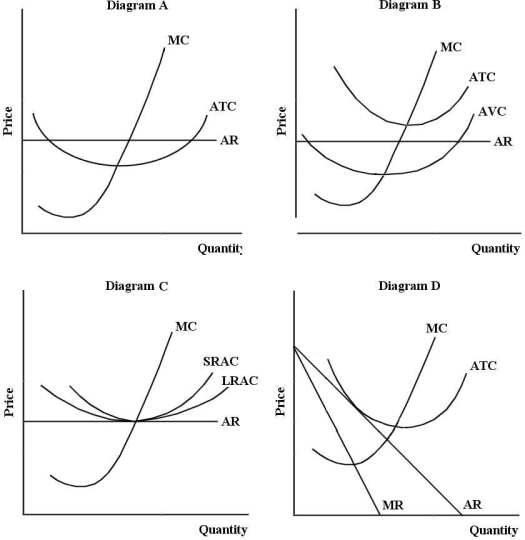
-Refer to Figure 11- 2. Diagram C depicts a typical firm in long- run equilibrium in
A) an imperfectly competitive industry
B) monopolistic industry.
C) oligopolistic industry.
D) monopolistically competitive industry.
E) a perfectly competitive industry.
Correct Answer:
Verified
Q13: Which of the following products is best
Q14: An example of a Canadian industry composed
Q15: The diagram below shows demand and cost
Q16: A Nash equilibrium
A) is an example of
Q17: When a monopolistically competitive industry is in
Q19: A monopolistically competitive firm is predicted to
Q20: Consider an example of the prisoner's dilemma
Q21: Suppose the market for gasoline retailing (gas
Q22: Suppose two firms, Allstom from France,
Q23: Consider an example of the prisoner's dilemma
Unlock this Answer For Free Now!
View this answer and more for free by performing one of the following actions

Scan the QR code to install the App and get 2 free unlocks

Unlock quizzes for free by uploading documents