The diagram below shows demand and cost curves for a monopolistically competitive firm. 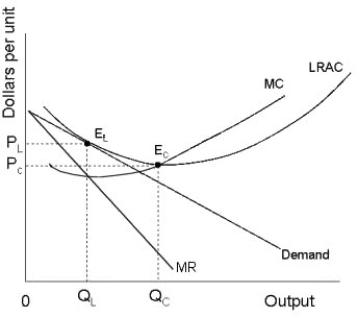 FIGURE 11- 3
-Refer to Figure 11- 3. In the long run, a monopolistically competitive firm will
A) produce the output where AC is at its minimum.
B) produce QC at Price PL.
C) produce QL at Price PC.
D) produce QC at Price PC.
E) produce QL at Price PL.
Correct Answer:
Verified
Q6: Suppose there are only two firms in
Q7: The table below shows the market
Q8: In which market structure are price fluctuations
Q9: "Brand proliferation" is an example of
A) an
Q10: Explicit collusion in an oligopolistic industry
A) occurs
Q12: A good example of a monopolistically competitive
Q13: Which of the following products is best
Q14: An example of a Canadian industry composed
Q15: The diagram below shows demand and cost
Q16: A Nash equilibrium
A) is an example of
Unlock this Answer For Free Now!
View this answer and more for free by performing one of the following actions

Scan the QR code to install the App and get 2 free unlocks

Unlock quizzes for free by uploading documents