The diagram below shows demand and cost curves for a monopolistically competitive firm. 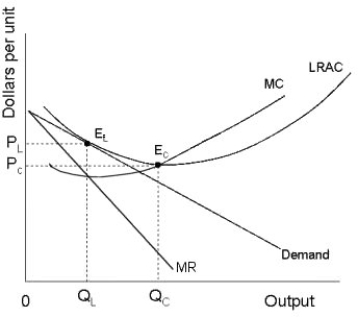 FIGURE 11- 3
-Refer to Figure 11- 3. In the long run, a monopolistically competitive firm will
A) make profit by producing at QC and charging price PL.
B) maximize profit by producing output level QC , the minimum point of its LRAC curve
C) lose money by producing at QL and charging price PC.
D) maximize profit but only break even by producing at QL and charging price PL.
E) maximize profit and make positive profit by producing at QL and charging price PL.
Correct Answer:
Verified
Q46: The diagram below shows demand and cost
Q47: A good example of a monopolistically competitive
Q48: Consider the following characteristics of a particular
Q49: Consider the following characteristics of a particular
Q50: The diagram below shows demand and cost
Q53: Q54: The diagram below shows selected cost and Q55: A characteristic of a monopolistically competitive market![]()
Unlock this Answer For Free Now!
View this answer and more for free by performing one of the following actions

Scan the QR code to install the App and get 2 free unlocks

Unlock quizzes for free by uploading documents