The diagram below shows selected cost and revenue curves for a firm in a monopolistically competitive industry. 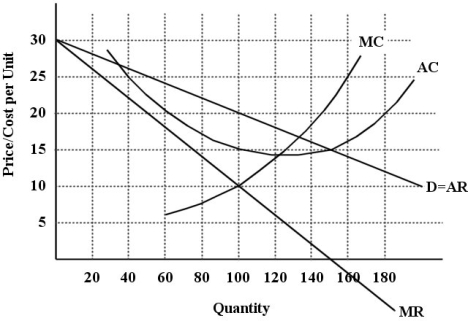 FIGURE 11- 1
-Refer to Figure 11- 1. If this firm is maximizing its profits, does the diagram depict a long- run equilibrium situation?
A) No, because this firm is a natural monopoly.
B) Yes, because this firm is producing where MC = MR and is earning economic profits.
C) Yes, because this firm is producing where MC = MR and is earning zero profits.
D) No, because this firm is suffering losses and firms will exit this market.
E) No, because this firm is earning profits which will attract new firms to this market.
Correct Answer:
Verified
Q100: If there are economic profits in a
Q101: Tacit collusion in an oligopolistic industry
A) occurs
Q102: Which of the following is an incorrect
Q103: An ineffective means of discouraging the entry
Q104: The excess- capacity theorem predicts
A) that when
Q105: The diagram below shows demand and cost
Q106: The diagram below shows selected cost and
Q107: Consider the following characteristics of a particular
Q108: Suppose that a monopolistically competitive firm decides
Q110: A characteristic common to most imperfectly competitive
Unlock this Answer For Free Now!
View this answer and more for free by performing one of the following actions

Scan the QR code to install the App and get 2 free unlocks

Unlock quizzes for free by uploading documents