Suppose a monopolist faces the demand curve and cost curves shown below. 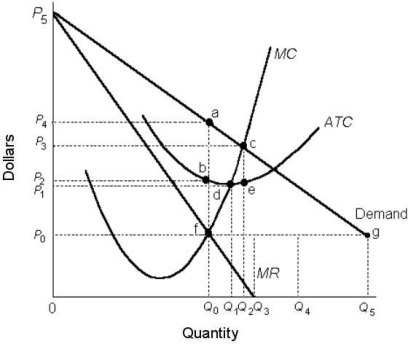 FIGURE 10- 4
-Refer to Figure 10- 4. If this single- price monopolist is producing at the profit- maximizing level of output, the total profit is represented by the area
A) 0P0fQ0.
B) P4abP2.
C) P3ceP2.
D) 0P2bQ0.
E) 0P4aQ0.
Correct Answer:
Verified
Q2: The diagram below shows a pharmaceutical firm's
Q3: The figure below shows the demand
Q3: Q4: At the profit- maximizing level of output Q5: One of the reasons cartels are considered Q6: A number of firms agreeing together to Q8: If a monopolist is practicing perfect price Q9: Which one of the following is a Q11: Suppose a monopolist faces the demand curve Q12: Suppose that a single- price monopolist![]()
Unlock this Answer For Free Now!
View this answer and more for free by performing one of the following actions

Scan the QR code to install the App and get 2 free unlocks

Unlock quizzes for free by uploading documents