The figure below shows the demand schedule and demand curve for a product produced by a single- price monopolist. 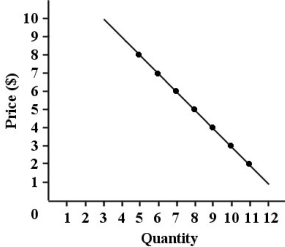 FIGURE 10- 1
-Refer to Figure 10- 1. Suppose this single- price monopolist is initially selling 9 units at $4 each and then reduces the price of the product to $3. By making this change, the firm is giving up revenue of
And gaining revenue of _. Its marginal revenue is therefore . (All figures are dollars)
A) 34; 28; - 6
B) 9; 3; - 6
C) 40; 27; - 13
D) 3; 9; 6
E) 30; 36; 6
Correct Answer:
Verified
Q48: Your food- services company has been
Q49: The diagram below shows a pharmaceutical firm's
Q50: Price discrimination, if possible, allows a price-
Q51: Suppose a monopolist faces the demand curve
Q55: Suppose that a single- price monopolist
Q56: If a monopolist is practicing perfect price
Q57: Economic profit for a monopolistic firm will
Q58: Your food- services company has been
Q74: Your food-services company has been named as
Q80: Your food-services company has been named as
Unlock this Answer For Free Now!
View this answer and more for free by performing one of the following actions

Scan the QR code to install the App and get 2 free unlocks

Unlock quizzes for free by uploading documents