The diagram below shows a pharmaceutical firm's demand curve and marginal cost curve for a new heart medication for which the firm holds a 20- year patent on its production. 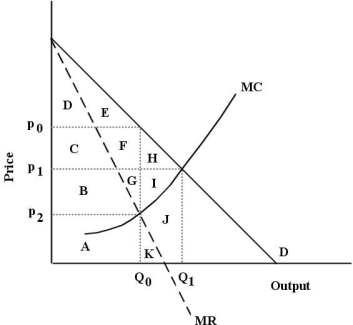 FIGURE 10- 5
-Refer to Figure 10- 5. Assume this pharmaceutical firm charges a single price for its drug. At its profit- maximizing level of output, it will generate a total profit represented by
A) areas B+C+F+G+H+I.
B) the sum of areas A through K.
C) areas A+B+C+F+G.
D) areas D+E.
E) - it is not possible to determine with the information provided.
Correct Answer:
Verified
Q56: If a monopolist is practicing perfect price
Q57: Economic profit for a monopolistic firm will
Q58: Your food- services company has been
Q59: The diagram below shows a pharmaceutical firm's
Q60: Suppose a monopolist faces the demand curve
Q62: Consider the following AR and MR curves
Q63: Consider a monopolist that is able to
Q64: Many clothing retailers allow you to go
Q65: Suppose the technology of an industry is
Q66: If a single- price monopoly is presently
Unlock this Answer For Free Now!
View this answer and more for free by performing one of the following actions

Scan the QR code to install the App and get 2 free unlocks

Unlock quizzes for free by uploading documents