The diagram below shows total revenue for a single- price monopolist. 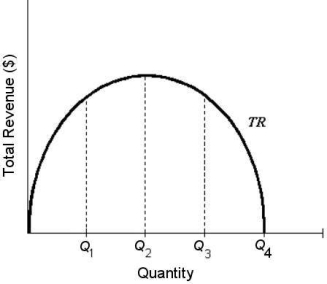 FIGURE 10- 3
-Refer to Figure 10- 3. The price elasticity of demand at Q3 is
A) less than 1.
B) greater than 1.
C) zero.
D) equal to 1.
E) not determinable from the diagram.
Correct Answer:
Verified
Q67: The main argument of Joseph Schumpeter's idea
Q68: If a single- price monopolist sets price
Q69: Suppose you go to a retailer's website
Q70: Monopolistic firms do not have supply curves
Q71: Relative to a firm that must charge
Q73: For a monopolist, the profit- maximizing level
Q74: Which of the following statements describes a
Q75: A monopoly is distinguished from a firm
Q76: Suppose the market for some product can
Q77: If a single- price monopolist's price equals
Unlock this Answer For Free Now!
View this answer and more for free by performing one of the following actions

Scan the QR code to install the App and get 2 free unlocks

Unlock quizzes for free by uploading documents