Suppose a monopolist faces the demand curve and cost curves shown below. 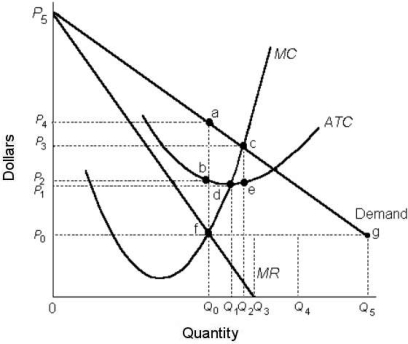 FIGURE 10- 4
-Refer to Figure 10- 4. If this single- price monopolist is producing at the profit- maximizing level of output, the total revenue is represented by the area
A) 0P3cQ2.
B) 0P4aQ0.
C) 0P2bQ0.
D) 0P0gQ5.
E) 0P1dQ1.
Correct Answer:
Verified
Q98: The diagram below shows a pharmaceutical firm's
Q98: FIGURE 10- 4 Suppose a monopolist faces
Q99: The marginal revenue curve facing a single-
Q100: Which of the following statements about single-
Q101: Suppose that a single- price monopolist
Q102: Your food- services company has been
Q104: Consider the following AR and MR curves
Q105: Refer to Figure 10- 2. The price
Q106: Refer to Figure 10- 4. If this
Q107: The diagram below shows a pharmaceutical firm's
Unlock this Answer For Free Now!
View this answer and more for free by performing one of the following actions

Scan the QR code to install the App and get 2 free unlocks

Unlock quizzes for free by uploading documents