The diagram below shows two production possibilities boundaries for Country X. 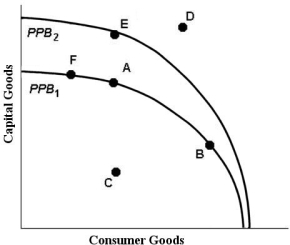 FIGURE 1- 3
-Refer to Figure 1- 3. At point B,
A) the opportunity cost of producing an extra unit of consumption goods is higher than at point A.
B) the price of capital goods is higher than the price of consumption goods.
C) the opportunity cost of producing an extra unit of capital goods is higher than at point A.
D) Country X is producing too many consumption goods and too few capital goods.
E) the price of consumption goods is equal to the price of capital goods.
Correct Answer:
Verified
Q2: The Canadian economic system can best be
Q3: Suppose Andrea has a job that pays
Q5: Consider the production possibilities boundary (PPB)of an
Q7: Economists usually assume that households and firms,
Q9: A farmer selling tomatoes and corn at
Q11: A barter system of exchange
A)requires the use
Q12: Karl Marx argued that
A)centrally planned economies could
Q13: The downward- sloping line in the diagram
Q14: Madeleine allows herself $100 per month for
Q121: In a pure market economy, the role
Unlock this Answer For Free Now!
View this answer and more for free by performing one of the following actions

Scan the QR code to install the App and get 2 free unlocks

Unlock quizzes for free by uploading documents