The diagram below shows two production possibilities boundaries for Country X. 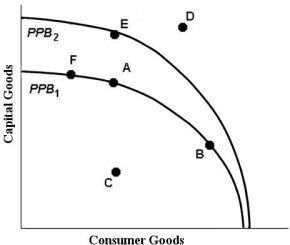 FIGURE 1- 3
-Refer to Figure 1- 3. If Country X were producing at point C,
A) it is not possible to move to any point on PPB1 or PPB2 without technological progress.
B) this is the maximum output possible from given resources.
C) the opportunity cost of moving to point A is to give up some capital goods.
D) the opportunity cost of moving to point B is to give up some consumption goods.
E) the opportunity cost of moving to point A is zero.
Correct Answer:
Verified
Q8: Income redistribution in a mixed economy
A)risks reducing
Q15: Consider a production possibilities boundary showing the
Q25: Suppose fire destroy many millions of hectares
Q30: If there is always a three- for-
Q31: Economics is the study of
A)how to limit
Q32: Economics is generally NOT concerned with
A)restricting the
Q37: The table below illustrates that, in
Q37: In mixed economies, economic behaviour is
A)based primarily
Q40: The diagram below shows two production possibilities
Q41: The diagram below shows two production possibilities
Unlock this Answer For Free Now!
View this answer and more for free by performing one of the following actions

Scan the QR code to install the App and get 2 free unlocks

Unlock quizzes for free by uploading documents