The diagram below shows two production possibilities boundaries for Country X. 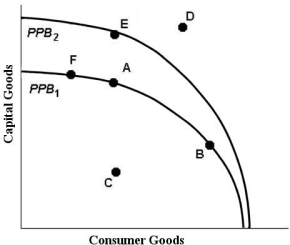 FIGURE 1- 3
-Refer to Figure 1- 3. A shift of the production possibilities boundary from PPB1 to PPB2 implies
A) that if point E is the new choice of outputs, productivity has increased in the consumption goods industry.
B) a movement from full employment to some unemployment.
C) that technology in the capital goods industries has improved.
D) that technology in the consumption goods industry has improved.
E) an inevitable decrease in total output.
Correct Answer:
Verified
Q21: Suppose that one unit of labour can
Q26: Because resources are scarce, individuals are required
Q27: Suppose there are only two goods produced
Q29: The circular flow of income illustrates
A)the flows
Q32: Economics is generally NOT concerned with
A)restricting the
Q37: In mixed economies, economic behaviour is
A)based primarily
Q40: Suppose drought destroys many millions of acres
Q44: The downward- sloping line in the diagram
Q50: With a budget of $200 million, the
Q51: With a budget of $200 million, the
Unlock this Answer For Free Now!
View this answer and more for free by performing one of the following actions

Scan the QR code to install the App and get 2 free unlocks

Unlock quizzes for free by uploading documents