Use the graph to answer the following questions. 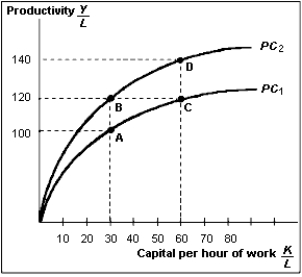 (A) Suppose that between twa grven years, prowth in capital per haur af wark and prowth in techology were both pasitive. pick two points an the eraph that represent such a 5cenaria.
(B) Suppose that between twa given years, 파th in capital per hour of wark was zerd, and Jrowth in technolagy was positive. Pick twa paints on the graph that represent such a 5cenaria.
(C) Suppose that between twa given years, growth in capital per hau of wark was pasitive, and growth in technoldoy was negative. Pick wo paints an the graph that represent such a scenarid. What happened to procictivity in this particular case?
Correct Answer:
Verified
(B)...
View Answer
Unlock this answer now
Get Access to more Verified Answers free of charge
Q141: According to the growth-accounting formula, productivity growth
A)can
Q142: Exhibit 21-1 Q146: Explain why the discussion about the former Q147: The slope times the change along the Q147: Answer the questions below:
![]()
(A) Suppose a
Unlock this Answer For Free Now!
View this answer and more for free by performing one of the following actions

Scan the QR code to install the App and get 2 free unlocks

Unlock quizzes for free by uploading documents