The figure below shows real and nominal GDP for a hypothetical economy between 2000 and 2015. Assume this economy had the same inflationary experience as the United States did over this period. 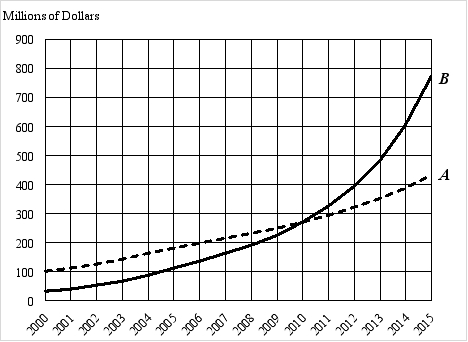

(A) What year is the ba5e year?
(B) Which 5 eries is real GDP?
(C) Priar to the base year, is real GDP Preater than or less than nominal GDP? Why?
Correct Answer:
Verified
(B)
(C) Prior to...
View Answer
Unlock this answer now
Get Access to more Verified Answers free of charge
Q143: The consumption of leisure
A)is always omitted from
Q148: If a parent spends one hour each
Q151: To be included in GDP, an activity
Q152: The CPI tends to understate inflation.
Q153: Exhibit 18-8 Q154: Which of the following statements is false? Q157: How do the CPI and the GDP Q158: Which of the following statements is true? Q160: Exhibit 18-8 Q162: There is no correlation between the decline
![]()
A)Some
A)The
![]()
Unlock this Answer For Free Now!
View this answer and more for free by performing one of the following actions

Scan the QR code to install the App and get 2 free unlocks

Unlock quizzes for free by uploading documents