The figure below shows the effect of a 2011 increase in government purchases on the hypothetical path of real GDP compared to the path of potential GDP (the baseline) between 2011 and 2016. 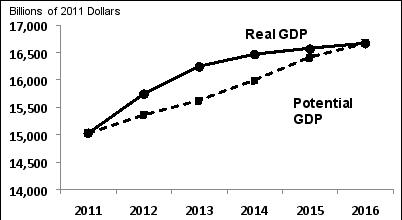 Potential
GDP (A) Using the cirve and line anglysis, expleng what is accurting between 2011 ant
(B) Using the curve and line analysis, exglain what is accurring between 2012 ant 2014 .
(C) Using the curve and line malysis, exglanin what is accuring between 2014 and 2016
Correct Answer:
Verified
View Answer
Unlock this answer now
Get Access to more Verified Answers free of charge
Q62: If the Fed thinks inflation is too
Q66: Suppose the relationship between real GDP
Q66: If the Fed raises interest rates because
Q67: Why do net exports increase when government
Q68: Which of the following is the best
Q70: According to the economic fluctuations model, what
Q72: What is the difference between deflation and
Q75: The long-run effect of a change in
Q76: Compared to the baseline, the short-run effect
Q79: If the Fed is worried about inflation
Unlock this Answer For Free Now!
View this answer and more for free by performing one of the following actions

Scan the QR code to install the App and get 2 free unlocks

Unlock quizzes for free by uploading documents