Exhibit 24-5 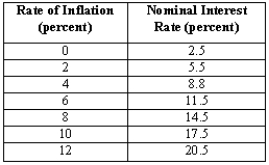
-The data in Exhibit 24-5 depicts the monetary policy response to inflation by a central bank. Use the values in this table to plot the monetary policy response rule line, and explain whether this is a valid response rule or not.
Correct Answer:
Verified
View Answer
Unlock this answer now
Get Access to more Verified Answers free of charge
Q130: How do changes in real interest rates
Q131: Explain what will happen to the aggregate
Q132: Suppose, because of a foreign crisis, the
Q133: Does the Fed have an explicit inflation
Q134: The inflation adjustment line is a flat
Q136: If the Fed aims to influence economic
Q137: The Fed issues a statement right after
Q138: The IA line shows
A)the rate of change
Q139: The inflation adjustment line is flat because
A)firms
Q140: Suppose the central bank decides to switch
Unlock this Answer For Free Now!
View this answer and more for free by performing one of the following actions

Scan the QR code to install the App and get 2 free unlocks

Unlock quizzes for free by uploading documents