The figure below plots real and potential GDP between 1971 and 1977. Given the data in the corresponding table, can changes in the rate of inflation over this period be explained by the percent deviation between real and potential GDP? Do these data support or refute the validity of the assumptions about the IA line? 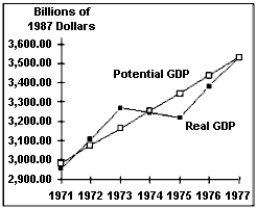
Correct Answer:
Verified
View Answer
Unlock this answer now
Get Access to more Verified Answers free of charge
Q161: The intersection of the inflation adjustment line
Q162: Exhibit 24-6 Q165: Which of the following would be most![]()
Unlock this Answer For Free Now!
View this answer and more for free by performing one of the following actions

Scan the QR code to install the App and get 2 free unlocks

Unlock quizzes for free by uploading documents