A.You are measuring the effect of temperature on the rate of an enzyme-catalyzed reaction.If you plot reaction rate against temperature, which of the graphs in Figure 3-64 would you expect your plot to resemble?
B.Explain why temperature has this effect. 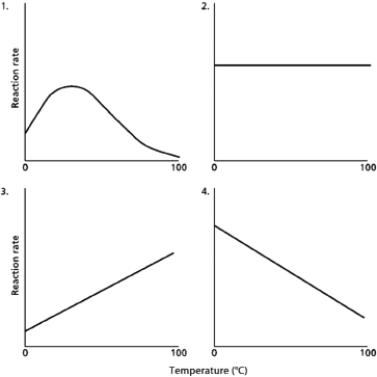
Figure 3-64
Correct Answer:
Verified
B.An increase in t...
View Answer
Unlock this answer now
Get Access to more Verified Answers free of charge
Q37: The small molecule cyclic AMP (cAMP) takes
Q38: The equilibrium constant (K) for the reaction
Q39: Activated carriers are small molecules that can
Q40: The study of enzymes also includes an
Q41: Indicate whether the following statements are TRUE
Q43: If you weigh yourself on a scale
Q44: Hydrolysis reactions are commonly used inside the
Q45: All of the biological molecules listed below
Q46: Arrange the following molecules in order with
Q47: Indicate whether the following statements are TRUE
Unlock this Answer For Free Now!
View this answer and more for free by performing one of the following actions

Scan the QR code to install the App and get 2 free unlocks

Unlock quizzes for free by uploading documents