Figure 3-72 illustrates the amount of energy per molecule for a population in a contained, controlled environment.Most molecules will have the average energy of the population, shown in region 1.The number of molecules in the population with enough energy to be converted to product is shown in region 2.The number of molecules with enough energy to react in the presence of enzyme is shown in region 3.Use this information to explain how enzymes catalyze reactions. 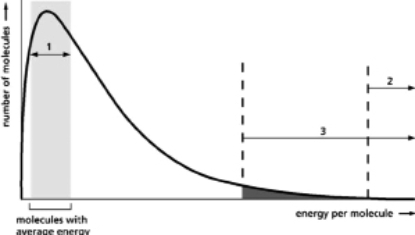
Figure 3-72
Correct Answer:
Verified
View Answer
Unlock this answer now
Get Access to more Verified Answers free of charge
Q63: Although the biochemical study of reaction rates
Q64: Consider an analogy between reaction-coupling and money.In
Q65: For each of the following sentences,
Q66: Enzymes A and B catalyze different
Q67: The addition of a new deoxynucleotide to
Q68: Two college roommates do not agree on
Q69: Activated carriers store energy in different types
Q71: Chemical reactions are reversible; they can proceed
Q72: Assume that the average human adult requires
Q73: In the cytoplasm, materials are organized, separated,
Unlock this Answer For Free Now!
View this answer and more for free by performing one of the following actions

Scan the QR code to install the App and get 2 free unlocks

Unlock quizzes for free by uploading documents