The graph in Figure 17-18 shows the time course of the polymerization of pure tubulin in vitro.Assume that the starting concentration of free tubulin is higher than it is in cells. 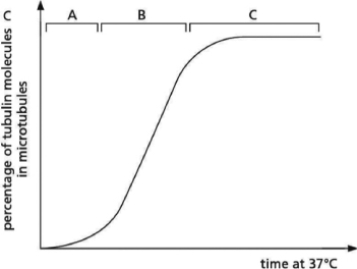 Figure 17-18
Three parts of the curve are labeled above it as A, B, and C.You conduct a similar in vitro tubulin-polymerization experiment, only this time you include purified centrosomes in your preparation.When you plot your data, which part of your graph should be most dissimilar to the curve shown in Figure 17-18?
A) A
B) B
C) C
D) None.The shape of my graph should be identical to the graph produced when tubulin is polymerized in the absence of purified centrosomes.
Correct Answer:
Verified
Q1: Which of the following statements about the
Q3: Which of the following statements about organellar
Q4: Which of the following statements about the
Q5: The hydrolysis of GTP to GDP carried
Q6: Keratins, neurofilaments, and vimentins are all categories
Q7: Which of the statements below about intermediate
Q8: Which of the following statements regarding dynamic
Q9: You are interested in understanding the regulation
Q10: Which of the following statements about the
Q11: Intermediate filaments are made from elongated fibrous
Unlock this Answer For Free Now!
View this answer and more for free by performing one of the following actions

Scan the QR code to install the App and get 2 free unlocks

Unlock quizzes for free by uploading documents