The graph in Figure 17-10 shows the time course of the polymerization of pure tubulin in vitro.You can assume that the starting concentration of free tubulin is much higher than it is in cells. 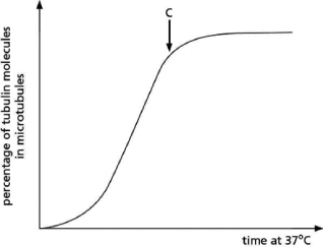
Figure 17-10
A.Explain the reason for the initial lag in the rate of microtubule formation.
B.Why does the curve level out after point C?
Correct Answer:
Verified
View Answer
Unlock this answer now
Get Access to more Verified Answers free of charge
Q37: Which of the following statements about skeletal
Q38: Consider the in vitro motility assay using
Q39: Compared to the normal situation, in which
Q40: For both actin and microtubule polymerization, nucleotide
Q41: For each of the following sentences,
Q43: Do you agree or disagree with this
Q44: In the three cell outlines in Figure
Q45: You isolate some muscle fibers to
Q46: Figure 17-21 shows two isolated outer-doublet microtubules
Q47: Your friend discovers a protein that she
Unlock this Answer For Free Now!
View this answer and more for free by performing one of the following actions

Scan the QR code to install the App and get 2 free unlocks

Unlock quizzes for free by uploading documents