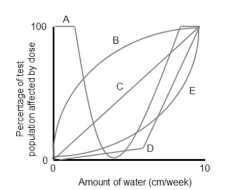
A student wants to test the toxicity of water on corn plants.After providing different amounts of water to different groups of corn plants for the duration of a growing season,the student graphed the results.The graph is most likely to look like which of the dose -response curves depicted above?
A) A
B) B
C) C
D) D
E) E
Correct Answer:
Verified
Q31: Initiated in 2007,the REACH program _
A)requires all
Q32: Explain and give an example of biomagnification.Identify
Q33: Louis Guillette is well known for his
Q34: _ is a naturally occurring substance that
Q35: How is the precautionary principle used in
Q37: Studies of endocrine disruptors have shown that
Q38: The "dirty dozen" POPs targeted by the
Q39: What are the properties of toxicants that
Q40: Debate over the use of DDT to
Q41: What does the field of environmental health
Unlock this Answer For Free Now!
View this answer and more for free by performing one of the following actions

Scan the QR code to install the App and get 2 free unlocks

Unlock quizzes for free by uploading documents